
DORA's research makes a claim that runs against much engineering intuition: speed and stability are not trade-offs. Across its data, the software delivery metrics move together for most teams. Top performers do well on all of them and low performers do poorly on all of them.1 That finding is why the metrics are worth measuring. How they are usually misused is why so many teams end up distrusting them.
DORA is a research programme run by Google Cloud.1 This article covers the current five metrics, where the data for each one comes from, and how to use them to find the constraint in your delivery process, rather than to set targets that people learn to hit.
The five metrics
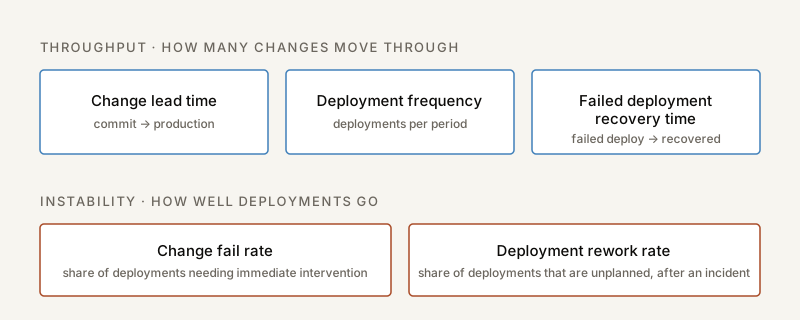
DORA groups its metrics into two factors.1
Throughput, meaning how many changes can move through the system over time:
- Change lead time: the time from a change being committed to version control to it being deployed in production.
- Deployment frequency: the number of deployments over a period, or the time between deployments.
- Failed deployment recovery time: the time it takes to recover from a deployment that fails and needs immediate intervention.
Instability, meaning how well deployments go:
- Change fail rate: the ratio of deployments that need immediate intervention afterwards, likely a rollback or a hotfix.
- Deployment rework rate: the ratio of deployments that are unplanned and happen because of an incident in production.
Free to reuse under CC BY 4.0 with a link to this article. Download
If you learned the "four keys", note the changes. DORA's guidance describes a shift from the original four keys to the current five-metric model, including the move from mean time to recovery (MTTR) to failed deployment recovery time.1 The narrower definition matters. It measures recovery from failed deployments, not from every kind of outage, which keeps the metric about the delivery process rather than about infrastructure incidents in general.
Where the data comes from
DORA itself warns against over-investing in measurement. Building integrations across many systems to get precise data "might not be worth the initial investment". It suggests starting with conversations, the DORA Quick Check, or an existing tool with pre-built integrations.1
How the metrics get gamed
DORA lists the pitfalls it sees most often:1
- Setting metrics as a goal. DORA cites Goodhart's law: broad mandates such as "every application must deploy multiple times per day by year's end" make it more likely that teams game the numbers.
- One metric to rule them all. Complex systems need several metrics, including some with healthy tension between them.
- Using industry as a shield, for example claiming that regulation rules out change.
- Making disparate comparisons. Comparing metrics between very different applications, such as a mobile app and a mainframe system, can be misleading.
- Siloed ownership. Giving different metrics to development, operations and release teams leads to friction and finger-pointing.
- Competing against other teams or organisations, instead of improving on your own baseline.
- Focusing on measurement at the expense of improvement.
Using them to improve
DORA's recommended loop is short.1 Gather the cross-functional team responsible for an application. Set a baseline, for example with the DORA Quick Check. Discuss the friction points in the delivery process, perhaps by mapping it. Commit to improving the most significant constraint. Turn that commitment into a plan with more specific leading measures. Do the work, check progress, and repeat.
The single change DORA highlights as a common way to improve all five metrics is reducing batch size. Smaller changes are easier to reason about, move through the process faster, and are easier to recover from when they fail.1
What the metrics do not tell you
- They are about delivery, not value. DORA describes the metrics as leading indicators for organisational performance and well-being, and lagging indicators for delivery practices.1 They say nothing directly about whether what you ship is worth shipping.
- They are per service. DORA says they are best suited to one application or service at a time, and that blending them across teams is problematic because contexts differ.1 An organisation-wide average is a number without a meaning.
- They depend on definitions. Two teams can report the same change fail rate while defining "failure" differently. Written definitions matter more than dashboards.
Frequently asked questions
- What are the DORA metrics?
- DORA currently uses five software delivery performance metrics. Three measure throughput: change lead time, deployment frequency and failed deployment recovery time. Two measure instability: change fail rate and deployment rework rate.
- Are there still four DORA metrics?
- No. DORA's guidance describes a shift from the original four keys to the current five-metric model, including a move from mean time to recovery (MTTR) to failed deployment recovery time.
- Should we compare DORA metrics between teams?
- DORA advises against it. The metrics are meant to be applied to one application or service at a time. Comparing very different applications, such as a mobile app and a mainframe system, can be misleading, and blending metrics across teams causes problems because their contexts differ.